
Gantt charts are invaluable tools for project managers. They keep track of who's working on what, dates, durations, delays and other important information. Gantt charts facilitate the work of teams managing large projects. But it's hard to create one without the right tools or an Excel Gantt chart template.
The best way to create a Gantt chart is to use a Work OS like monday.com. But if you're offline, or if a less customizable method is all you need, you can also create a Gantt chart in Excel.
We'll explain how to create a Gantt chart in Excel, on PC or Mac, and the easiest way to do it. We'll also provide you with an Excel Gantt chart template to make things easier for you. Let's get started!
How do I create a Gantt chart in Excel?
Technically, it's not possible to create a Gantt chart in Excel. So you'll need to create a stacked bar chart and customize it to look like a Gantt chart. Here are the steps to follow if you're using a PC:
- Fill in an Excel spreadsheet with your project schedule, noting each task in a column. Add the start and end dates and the duration of each task.
- Turn your Excel table into a stacked-bar chart by selecting an empty cell, then clicking on the "Insert" tab. In the "Charts" section, select "Bars", then "Stacked bars". Avoid choosing "Stacked bars 100 %", otherwise your Gantt chart won't look like much.
- Format your stacked bar chart by reversing the order of the tasks so that your critical path starts with task number 1. To do this, select all your task lists along the vertical axis of your Gantt chart, click on the "Bar Chart" icon and choose "Axis Format". You will then see a checkbox entitled "Categories in reverse order". Click on it.
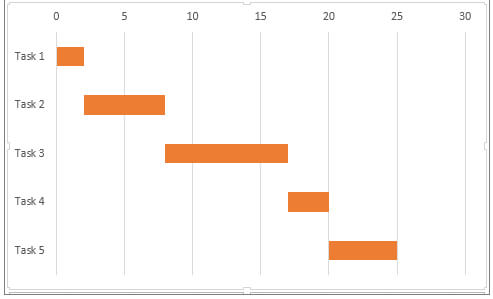
That's it! You have a Gantt chart that looks like this:
But remember, this is just the tip of the iceberg. Check out our ultimate guide to Gantt charts to learn more about the benefits of these tools. You can also download our free Excel Gantt chart template to make your life easier.
Discover how to create a Gantt chart in Excel on the Mac
Want to create a Gantt chart in Excel on your Mac, but don't know how? Don't panic, it's quite simple.
Here are the steps to follow:
- Create an Excel table
Start by listing all your project tasks in an Excel spreadsheet. - Turn your Excel table into a stacked bar chart
Select your data table and click on the "Insert" tab in the Excel ribbon. Then click on "Bars" and choose "Stacked bars". - Customize your Excel bar chart
To start your graph with the first tasks, reverse the order of the tasks. To do this, hold down the Ctrl key and select your vertical axis. Then click on "Axis format" and select "Categories in reverse order" in the "Axis position" section. To make your chart more aesthetically pleasing, you can also add colors by clicking on the data series, selecting the "Format" tab and choosing "Fill" then "No fill".
Once you've completed these steps, you can customize your graphic according to your preferences and save it as a template for future use.
Is there a Gantt chart template in Excel?
Yes, but only for PC users. If you work on a Mac, you'll have to make do without a template. However, you can use the free Gantt chart templates for Excel from monday.com if you wish.
Use monday.com to create a Gantt chart in just a few clicks
If you don't want the hassle of creating your Gantt chart manually, you can use a Work OS such as monday.com. It's quick and easy. Just follow the instructions to create your Gantt chart in just a few clicks.
So what are you waiting for?
The easiest way to create a Gantt chart
If you want to create a Gantt chart quickly and easily, you can opt to use a Work OS like monday.com. It's ultra-simple: just create a table and add your tasks, then a column for deadlines. Then you choose the due dates or Gantt view, and voila, you've got your Gantt chart in just a few minutes. You can also customize colors, filters, groups and more. There's no complicated formatting or endless navigation. And you can even track the percentage of tasks completed.
If you prefer to use Excel, you can also create a Gantt chart in just a few steps on a PC or Mac. On the Mac, simply create your Excel spreadsheet and transform it into a stacked bar chart. Then, to obtain your Gantt chart in reverse task order, hold down the Ctrl key and select your vertical axis, then click on "Axis format" and select "Categories in reverse order" in the "Axis position" section. If you're working on a PC, Microsoft Office offers a time-saving Excel Gantt chart template.
However, for a more dynamic and attractive Gantt chart, we recommend monday.com. The monday.com Excel Gantt chart template is free and can be used to create an Excel Gantt chart. It is customizable and allows you to keep track of all the important information concerning your project.
Don't hesitate to discover our Excel Gantt chart template to make your job easier!
Source: monday.com